Visual Grid Analytics

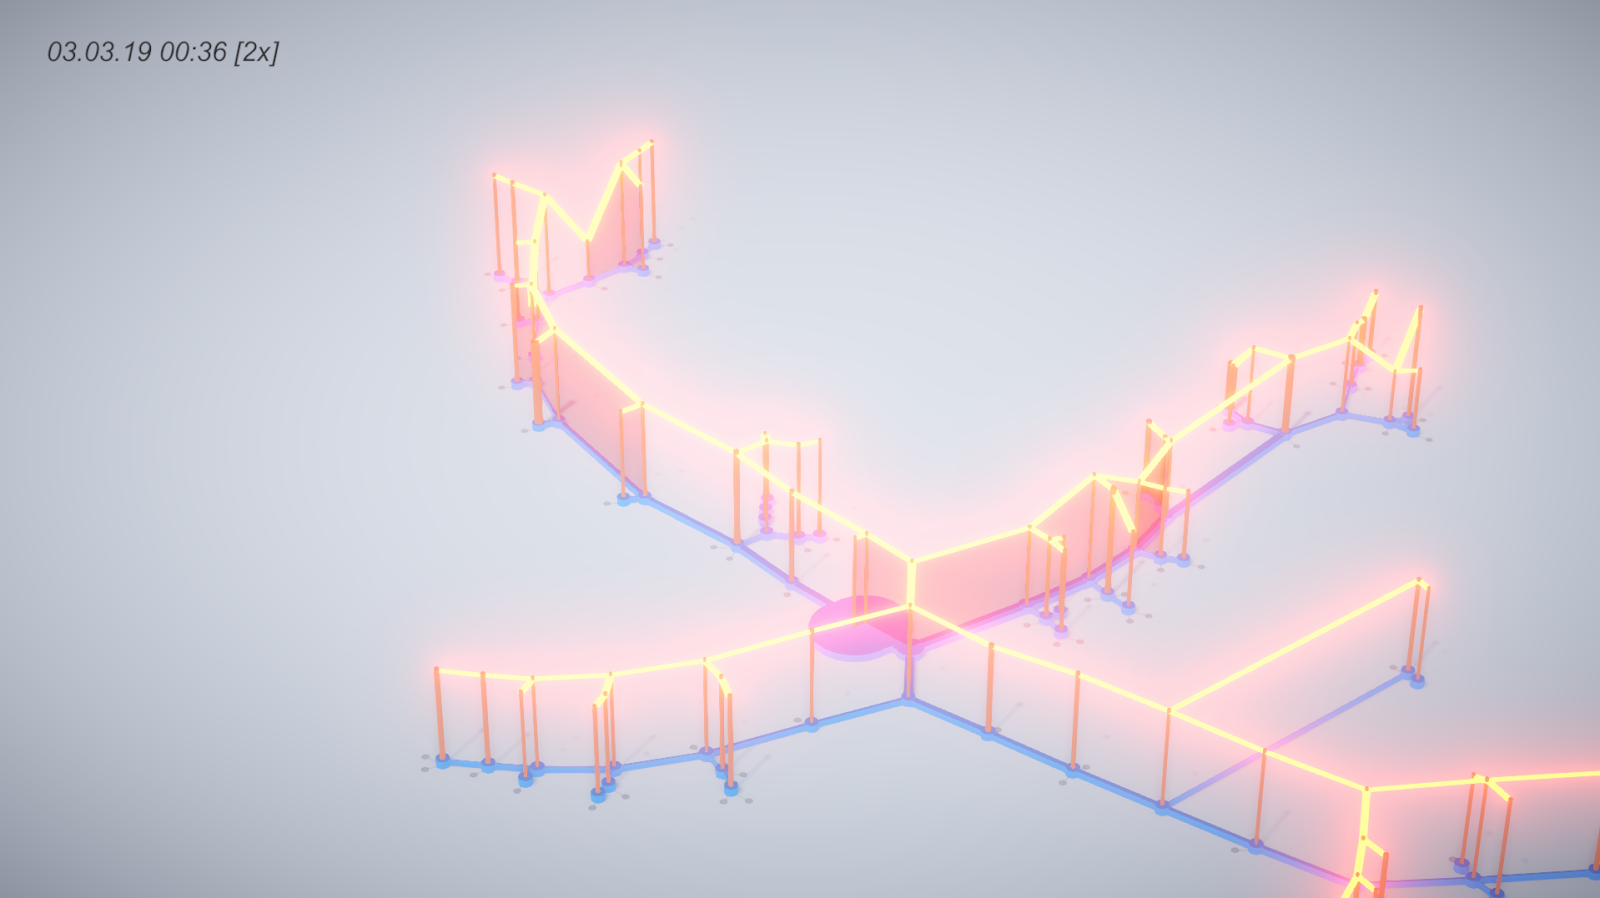
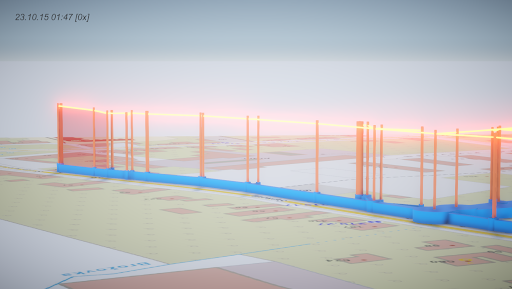
Transforming all the available data analytical insights into simple 3D visual elements, Mycroft Mind is able to show and provide explanation of a system as complex as an energy grid in a single three-dimensional scene. On a given substation and at given time, or even at given time period, it is possible to correlate the information about the energy flow, voltage level, consumption amount and events impacting the grid like home EV charging, non-technical losses, phase asymmetry, asset quality and many more. All the invaluable information in a single place, easily accessible, computed and visualized in real-time.
You can also visit the product web www.visualgridanalytics.com
The problems we solve for utilities
Detection and prioritization of technical
and non-technical losses
Being able to effectively identify and eliminate technical and non-technical losses (NTL) is often closely related to the profitability of a DSO. Smart metering can help a lot but is only one of a number of data sources needed.
An effective solution for non-technical losses combines data from smart meters, industrial meters, substations and predictions of reasonable technical losses. The solution takes the risk profile of each consumption point into account and estimates the probability and volume of non-technical losses.
The result is a prioritized list of NTL events, which helps DSOs route field workers to those situations, which are obvious and whose resolution will have a long term effect on DSO profitability.
Recognition and assessment of voltage problems
Smart meters and measurements taken at substations can be used to monitor voltage proactively and to detect, classify and prioritise problems. Our solution can distinguish between unimportant random voltage drops and peaks and those worsening trends over a longer period, which can lead to consumer complaints and to penalties for the DSO.
The effective processing of voltage problems includes the identification of those factors which have a particular bearing on the problem, examples being production from nearby photovoltaics or ambient outside temperatures. The correct identification of clusters of voltage problems is also very important, as in this way we can distinguish between an isolated problem at a single consumption point, a problem with a feeder or a problem at a high voltage level being experienced at the same time at neighbouring substations.
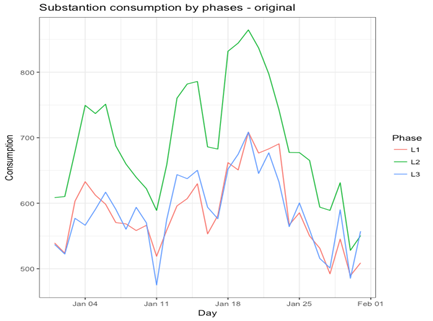
Detection and prioritization of phase asymmetry
Phase asymmetry needs to be kept within reasonable limits. With new photovoltaic sources being connected to the grid, often to just one phase, asymmetry is on the increase. Measurements from substations should therefore be systematically processed to automatically detect potentially unacceptable asymmetry variances and to distinguish between random small problems and problems which repeat and become worse.
Recognizing how phases are connected
Phases at a consumption point were typically connected randomly; utilities did not have a record of how this had been done. Having this information is of course important if a utility needs to solve an asymmetry issue or operate a single phase PLC communication. We have invented and proved a software algorithm, which can estimate from smart metering measurements how the phases at a given connection point are connected.
Optimizing phase connection
Our optimization algorithm will advise how phases at selected consumption points should be reconnected to keep asymmetry problems under control.
Recognition of consumption type
Consumption profiles taken every 15 minutes or hourly from smart meters can be used to estimate the types of consumption at a given consumption point. Being able to recognise electrical heating, air-conditioning, hot water boilers or EV charging activities can help reveal the potential for consumption flexibility in the grid and can lead to a better understanding of consumer behaviour.
Tariff utilization analyses
Data from smart meters allows consumption point behaviour to be analysed and compared with the tariff system in force. This data can form the basis of recommendations for changes in tariffs for certain consumers and can also identify customers misusing the existing tariff system.
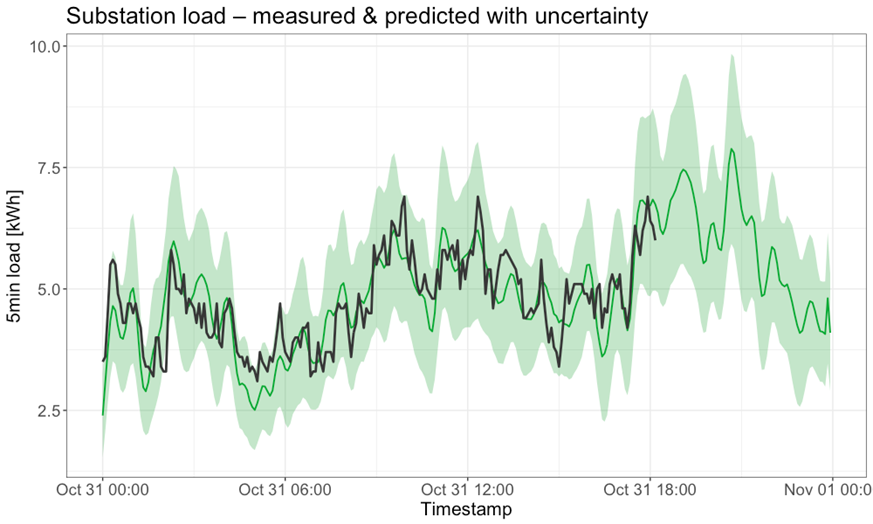
Energy consumption predictions
Smart metering opens the door for precise predictions for consumption by individual consumption point, by groups of consumption points, by feeders and by substation. Accurate consumption predictions are a basis for other advanced features such as demand side response.
Flexibility detection and prediction
Using consumption type recognition we are able to analyse consumption flexibility in the grid. We are able to predict the degree of flexibility in the grid at any given time and how individual consumption points are likely to react to responses affecting demand such as tariff switching or dynamic pricing.